Most duck producers start hatching duck eggs on instinct and calendar habits: whenever the hens are laying, whenever the incubator has space, whenever the season feels right. That’s how we started too. Actually, we had a grant to hatch eggs and it didn’t start until winter, so we set year round becasue that’s when we had the funding.
After two full hatch seasons — 2024 and 2025, 62 batches, 10,805 eggs set — we can tell you that the biology of duck fertility follows a tight, predictable curve. Set eggs at the right point on that curve and your results improve dramatically. Set eggs in the wrong months and you’re spending $1 per egg to produce ducklings that cost more than you can sell them for.
This post is the data. We’ll tell you what we found, what the biology behind it is, and how you can use it to plan your own hatch calendar.
The fertility bell curve on hatching duck eggs
When we aggregated all our batch records by month — weighting each month by total eggs set, so a 400-egg April batch counts more than a 9-egg September test — a clear pattern emerged. Duck egg fertility follows a bell curve that peaks hard in April and drops off a cliff in July.
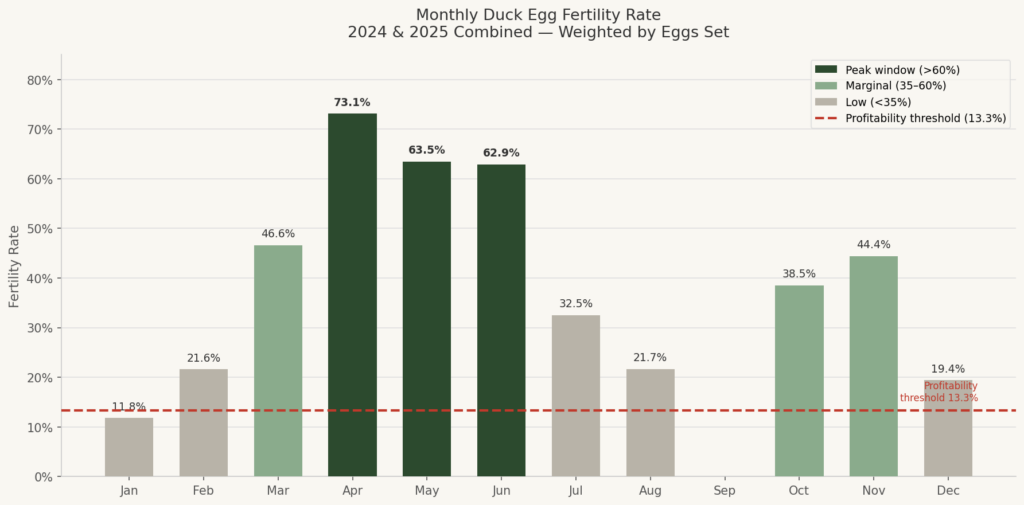
The peak window — months where more than 60% of eggs we set were fertile — runs from April through June. April alone hit 73.1% fertility across 2,172 eggs set. That was consistent across both years.
Why April? The biology of duck breeding season
Ducks are photoperiod-sensitive. Their reproductive cycles are regulated by day length, not temperature. As daylight increases through late winter and spring, it triggers hormonal changes in both hens and drakes. Drakes respond to increasing light with rising testosterone and sperm production. By April, day length has reached the point that triggers peak reproductive condition in domestic waterfowl in the northern hemisphere.
This is also why the drop-off in July is so dramatic — a cliff, not a slope. After the summer solstice on June 21, day length starts decreasing. Drakes begin winding down testosterone production almost immediately. Our data shows fertility falling from 62.9% in June to 32.5% in July: a 30 percentage point crash in a single month.
The drop from June to July is not a gradual decline. It is a biological switch, and it is happening in your drakes before you see it in your hatch rates.
The October comeback: a second window
One of the more surprising findings in our data is a real, repeatable secondary fertility shoulder in October and November. After the summer trough, fertility recovers to 38.5% in October and 44.4% in November — well below the April peak, but meaningfully above the July–August floor.
The biology here is the post-molt re-coupling cycle. Ducks go through a summer molt, emerging with fresh plumage by early fall. As they re-pair and as day length stabilizes, drakes come back into reproductive condition. This secondary window is shorter and less productive than spring, but it is real. Producers who want fall ducklings for holiday meat sales or spring poultry shows can plan around it.
Key finding: There are two usable windows in a duck hatch year. The primary window runs April through June at 60 to 73% fertility. The secondary window runs October through November at 38 to 44% fertility. Everything between and outside those windows produces marginal to poor results driven primarily by low fertility, not incubation failure.
What this means for your hatch calendar
If you are purchasing duck hatching eggs, time your orders to arrive during the primary fertility window — mid-March through end of June. If you are running your own flock, keep drakes in good body condition through winter and consider supplemental lighting in January and February to advance the photoperiod stimulus. Have your drake-to-hen ratios optimized before February and your breed pens seperated by Feb 1.
A note on data and limitations
This analysis covers 62 batches across 2024 and 2025 from Urban Wildfinds Farm and Forage in Kansas City, Kansas, under USDA SARE grant FNC25-1484. The flock is primarily Cayuga heritage breed with some mixed heritage birds. Results may differ for other breeds, climates, or management systems. September has only one batch of 9 eggs and should not be treated as a reliable monthly figure. We will update this analysis after the 2026 hatch season closes.
What’s next in this series
This is the first in a six-part series on data-driven duck production from USA Duck Team’s two-year incubation records. Upcoming posts will cover the single practice change that nearly doubled our hatch rate, why summer hatch rates fail, the economics of hatching by season, the October comeback, and three years of data.
If you are a duck producer in the central states and want to compare notes or add your hatch records to the dataset, join our producer network here.
This post is part of USDA SARE grant FNC25-1484, supporting USA Duck Team LLC’s heritage breed duck genetics operation and regional producer network based in Kansas City, Kansas. Corinna West, Managing Member, USA Duck Team LLC.
Pingback: Hatching duck eggs works better when you spray them - USA Duck Team