
If you have been following our research on Cayuga egg shell color and duckling phenotype prediction, you already know that the color of a duck egg on the outside tells you something real about what is on the inside. But here is a question we did not expect to be so interesting: does duck egg color also predict whether the egg will hatch at all?
The short answer is yes — and the pattern runs in the opposite direction from what breeders might hope. The eggs most likely to produce the prized all-black Cayuga duckling are also the eggs least likely to hatch successfully. That tradeoff deserves a close look.
What the Data Shows: Hatch Rate by Egg Shell Color
The chart below shows hatch rate broken out by egg shell color across our network from 2023 to 2025. Hatch rate here means the percentage of fertile eggs that successfully hatched — eggs that were confirmed fertile but did not produce a live duckling counted as losses. If you want to see examples of what we mean by each color, there are pictures on our blog where we predict what kind of duckling will come out of each egg color.
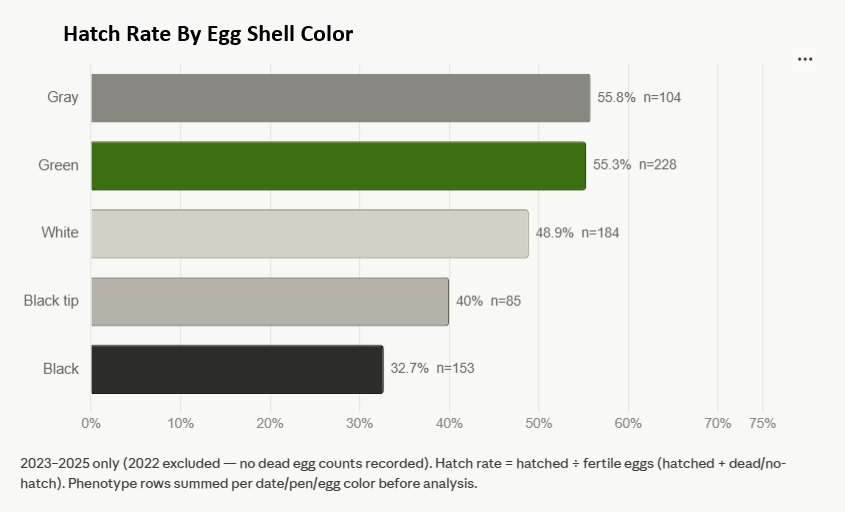
Reading the chart: each horizontal bar represents one egg color category. The longer the bar, the higher the percentage of fertile eggs that hatched. The number after each bar tells you how many fertile eggs were in that category.
Here is what the numbers show:
- Gray eggs: 55.8% hatch rate (n=104 fertile eggs)
- Green eggs: 55.3% hatch rate (n=228 fertile eggs)
- White eggs: 48.9% hatch rate (n=184 fertile eggs)
- Black tip eggs: 40.0% hatch rate (n=85 fertile eggs)
- Black eggs: 32.7% hatch rate (n=153 fertile eggs)
Gray and green eggs hatch at nearly identical rates, both just above 55%. Black eggs hatch at less than 33% — less than half the rate of gray and green. The hatch-rate analysis by eggshell color includes 754 fertile eggs for which eggshell color was documented. These records are drawn from a larger five-year USA Duck Team database containing several thousand eggs, although shell color was not recorded for every egg.
The Dead Egg Picture Tells the Same Story in Reverse
The chart below shows dead egg rate by egg color across all farms merged together, plus dead egg rate broken out by individual farm. Dead egg rate is simply the percentage of fertile eggs that failed to hatch — the mirror image of hatch rate.
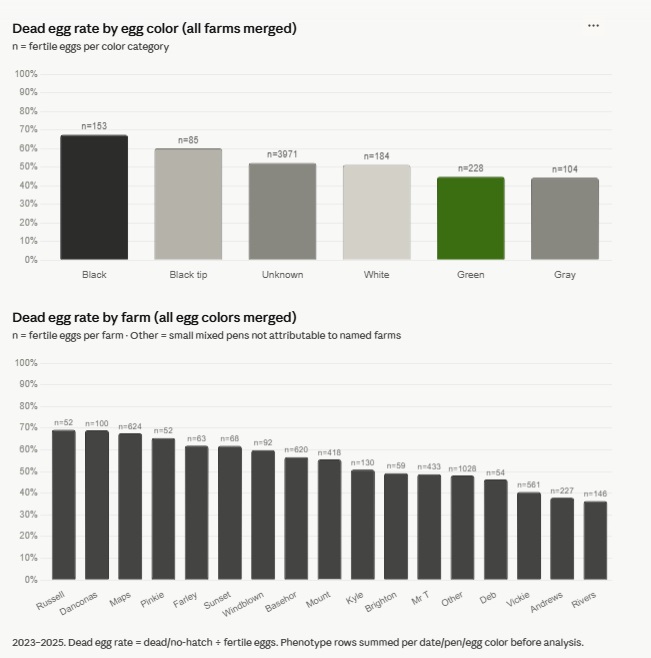
Reading the top chart: taller bars mean more eggs died before hatching. Black eggs have the tallest bar by a significant margin, at roughly 67-68%. Gray and green eggs have the shortest bars, confirming they lose the fewest fertile eggs during incubation.
The bottom chart shows dead egg rate for each farm in our network. This matters because it tells us that farm management — especially nest box cleanliness and egg collection practices — is a major driver of whether fertile eggs survive to hatch. Farms on the left side of the chart are losing more eggs. Farms on the right, including Rivers and Andrews, are losing fewer. Mr. T farm, which appears in the bottom third of dead egg rate, is running a cleaner-than-average operation by this measure. That matters because it means the within-pen hatch rate differences we see at Mr. T are not being driven by a dirty nest box or poor egg collection. The same logic applies to our Maps farm individual hen data below.
The fertility/hatch rate decoupling point ties everything together: cleanliness predicts fertility — whether the egg got fertilized — but once you have a fertile egg, shell properties and incubation conditions determine whether it hatches. Black eggs may be disadvantaged at that second stage regardless of how clean the nest box is.
The Strongest Evidence: Four Farms, Same Conditions Within Each
The chart below shows hatch rate by egg shell color within the same pen across four farms in our network. Each farm panel compares egg colors that were set together under identical conditions — same farm, same drake, same feed, same water, same everything. This controls for management variables that would otherwise confound the comparison.
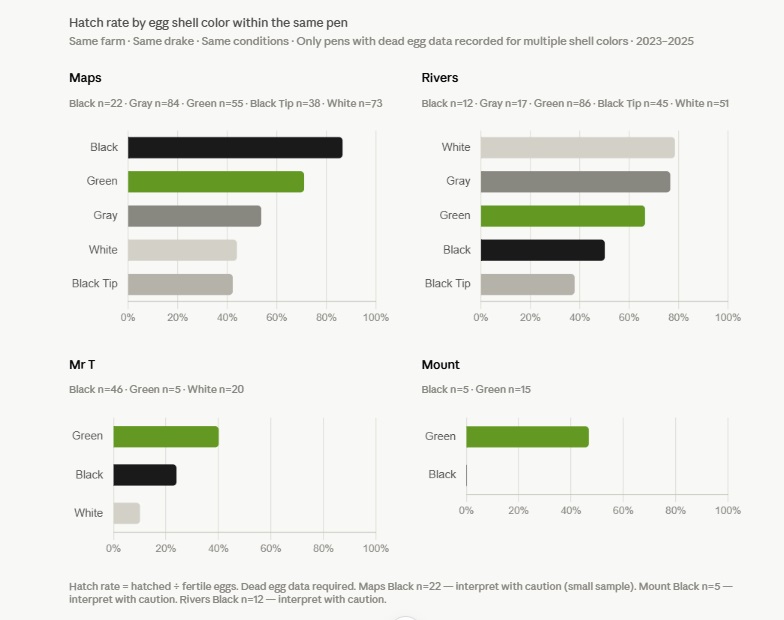
Reading the chart: each farm has its own panel. Within each panel, the bars show hatch rate for eggs of different colors set in that same pen. Longer bars mean more of those fertile eggs successfully hatched. The n numbers tell you how many fertile eggs were in each category.
At Maps farm in Kansas City, KS, egg color was tracked by individual hen rather than by written pen records since we could tell our girls’ eggs apart one year. We know from photo documentation that Pinkie and Mrs. Piggie laid black eggs, Violet and Speck laid white eggs, and Jada, Goldie, and Big Shiny laid gray eggs. All seven hens shared the same drakes and the same pen. The results: white eggs hatched at 49.5%, gray eggs at 40.0%, and black eggs at 30.0%.
At Mr. T farm in De Soto, Kansas — an all-Cayuga flock of about 10 hens and 2 drakes, one to two years old, on a windy hilltop bluff above the Kansas River — green eggs hatched best at 66.7%, followed by black at 34.0% and white at 30.0%.
At Mount farm in Kansas City, Missouri, green eggs hatched at 37.2% compared to black eggs at 30.0%, though the black egg sample there is only n=10, so interpret that number with caution.
At Rivers farm in Kansas City, KS, which has the most color diversity in the dataset, white and gray eggs led at 78.4% and 76.5% respectively, followed by green at 65.4%, black at 50.0%, and black tip at 37.8%. Rivers is a notably clean operation: their coop is a two car garage with a lot of room and clean bedding. They have consistently high hatch rates across all colors reflecting good management — but even here, black eggs rank fourth out of five colors.
The pattern that holds across three of four farms is clear: black eggs are never the top performer within any pen, and at most farms they sit at or near the bottom. Rivers is the one farm where black eggs are not last, but even there they rank fourth out of five colors.
The Individual Hen Data Makes It Even Clearer
Because Maps farm tracked eggs by individual hen rather than by pen color group, we can look at this one level deeper. The chart below shows hatch rate for each hen, color-coded by her egg color.
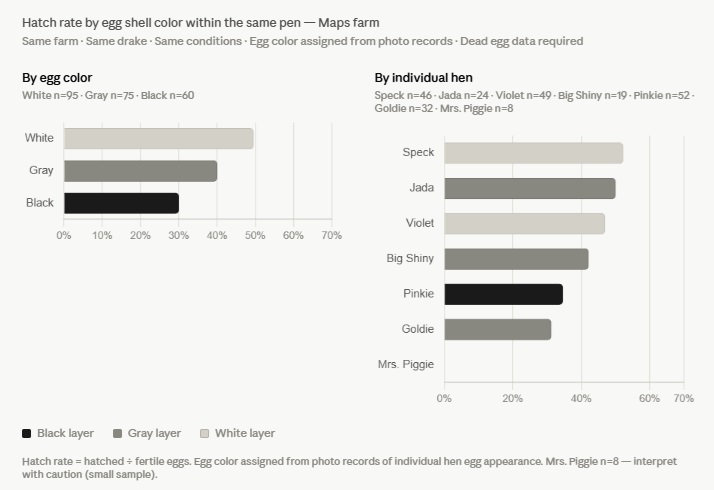
Reading the chart: each bar is one hen. The color of the bar matches the color of eggs she laid. The two dark bars — Pinkie at 34.6% and Mrs. Piggie at 0.0% — are both black-laying hens. The two light bars at the top — Speck at 52.2% and Violet at 46.9% — are both white-laying hens. The gray-laying hens land in the middle.
Mrs. Piggie’s n=8 is small enough to treat with caution, but Pinkie’s n=52 is a meaningful sample. Pinkie hatched at 34.6% — the second lowest in the pen — despite all seven hens sharing identical living conditions, the same drake, and the same incubator. The difference in outcome tracks directly with egg shell color.
One honest outlier: Goldie is a gray layer who performed at 31.2%, below both black-laying Pinkie and all the white layers. Individual hen variation exists within color categories, and egg color is a predictor of tendency, not a guarantee of outcome for any single bird.
Why Do Black Eggs Hatch Worse? Two Hypotheses
We have two leading explanations and we want to be honest that our data cannot fully separate them yet. Both may be contributing.
Hypothesis 1: Shell Bloom and Gas Exchange
Cayuga duck egg shell color is not paint — it is bloom, also called the cuticle, a coating deposited on the shell surface as the egg moves through the oviduct. Black Cayuga eggs have the heaviest bloom deposition. When you hold a black Cayuga egg, it feels different from a gray or green egg — the surface has more texture and the shell feels denser. If you crack one, the shell is harder. When you candle a black egg, it is significantly more opaque than a gray or green egg. Light has difficulty penetrating.
If light has difficulty penetrating, air may too. Developing duck embryos exchange gases through the shell — taking in oxygen and releasing carbon dioxide through microscopic pores. A thicker or denser cuticle could reduce that gas exchange, potentially stressing the embryo during development. We have also noted that black eggs that were classified more often as “solid” on candling — like a chicken egg — appear at higher rates among black eggs than among gray or green eggs. Whether those are truly infertile or simply unreadable through the dark shell is itself an open question.
This is a testable hypothesis that would require controlled laboratory measurement of shell permeability by color, which is beyond our current field study but is a logical next research step.
Hypothesis 2: Seasonal Confound
Cayuga hens do not lay the same color egg all season long. Early in the breeding season — roughly March and April in our region — hens produce their darkest eggs, often near-black. As the season progresses into May and June, eggs shift toward gray. By midsummer many hens are laying gray, green, or even white eggs from the same bird who was laying black in the spring.
This means that black eggs are disproportionately early-season eggs. Early-season eggs may have lower hatchability for reasons unrelated to shell color — hens are just returning to production, and ambient temperatures in March and April in Missouri and Kansas can swing dramatically, stressing eggs during storage or early incubation.
If black eggs are lower-hatch partly because they are early-season eggs, then shell color would be a marker of seasonal timing rather than a direct cause of hatch failure. Separating these two effects would require tracking individual hens’ egg color output across the full season alongside hatch outcomes — a study design we have not yet been able to execute at scale across the network. The Maps individual hen data is the closest we have come, since all hens were tracked simultaneously across the same season.
The Breeder’s Tradeoff
Here is the uncomfortable implication of this data for anyone selecting Cayuga breeding stock: the eggs most likely to produce an all-black Cayuga duckling — our most desirable heritage phenotype — are also the eggs least likely to hatch.
In our previous research on phenotype prediction from egg shell color, black eggs produced all-black Cayuga ducklings at the highest rate of any color category, around 67%. Gray eggs produced all-black ducklings at a lower rate, and eyestripe cayugas at a higher rate, but they hatched far more successfully. So if you set 100 black eggs and 100 gray eggs, you may end up with more all-black ducklings from the gray eggs simply because so many more of them hatch.
Our practical recommendation based on five years of network data: do not set only black eggs. Set a mix weighted toward gray and green, and use black eggs selectively when you have a specific phenotype goal and can afford the lower hatch rate. If you are trying to build flock numbers, gray and green eggs are your most efficient path. If you are trying to identify your best all-black genetics for a future breeding pen, black eggs from your top hens are worth setting despite the lower hatch rate.
What This Means for Farm Management
One thing this research confirms is that hatch rate and fertility rate are not the same thing. Fertility — whether an egg was fertilized — depends heavily on nest box cleanliness, egg collection frequency, and drake-to-hen ratio. Hatch rate — whether a fertile egg produces a live duckling — depends on shell properties, incubation conditions, and embryo health during development. In our five-year dataset, fertility rate did not significantly predict hatch rate (r = -0.26, not statistically significant). A clean nest box gets you fertile eggs. It does not guarantee those eggs will hatch.
For more on incubation best practices specific to heritage duck breeds, the Cornell Duck Research Laboratory hatching guide is an excellent resource. For breed-specific egg color and phenotype information, Holderread Waterfowl Farm has decades of Cayuga breeding experience that informed our own stock selection.
What We Still Do Not Know
Good research raises as many questions as it answers. Here is what our data cannot yet tell us:
- Whether shell bloom thickness directly impedes gas exchange in black Cayuga eggs, or whether the opacity we observe is surface-only
- Whether the lower hatch rate of black eggs is primarily a seasonal effect or a shell property effect — or both
- Whether washing or spraying black eggs before setting changes their hatch rate relative to unwashed black eggs
- Whether the same pattern holds in other breeds that lay dark-pigmented eggs
- Why Goldie, a gray layer, performed below the gray-layer average while sharing identical conditions with better-performing gray layers Jada and Big Shiny
This research is part of an ongoing five-year data collection effort at USA Duck Team, supported by North Central SARE Farmer/Rancher Grant FNC25-1484, with co-investigator Jennifer Reynolds of Lincoln University Cooperative Extension. We are working toward a peer-reviewed publication of the full dataset. If you are a heritage duck breeder who tracks egg color and hatch outcomes, we would love to hear from you at corinna@usaduckteam.com.